

Key Takeaways
|
RH Borden BASINiQ Finds I&I Down to the Exact Pipe Across 70 Miles Using 423 Sensors for Village of Great Neck, NY
RH Borden’s BASINiQ used 423 radar sensors across 70 miles to pinpoint 74 inflow and infiltration sources in Great Neck, NY, in four months instead of the usual 5 to 10 years.
Background
The Village of Great Neck, New York, faced significant challenges with inflow and infiltration (I&I) in its wastewater collection system. Excess stormwater and groundwater were entering the system through open caps, surface inflow, structural degradation, and illegal connections. These conditions increased treatment costs, strained system capacity, and posed environmental risks.
For a 10 MGD wastewater treatment plant, I&I of this scale can add an estimated $5.4 million per year in unnecessary treatment expenses. Traditional methods such as smoke testing, CCTV inspection, and manhole-by-manhole assessment are labor-intensive, often requiring five to ten years to identify only 20 to 25% of problem locations.
To address these challenges more efficiently, the Village partnered with RH Borden to implement the BASINiQ™ assessment platform, which integrates dense sensor monitoring, digital manhole scans, and weather-integrated analysis.
Why the Traditional Timeline Is So Long
It’s worth pausing on why “5 to 10 years” isn’t an exaggeration. Smoke testing and CCTV inspection can only cover a limited stretch of pipe per crew, per day, and both methods depend on catching a defect actively leaking or smoking at the exact moment an inspector happens to be there. According to the U.S. EPA, I&I-driven wet-weather flows already push many municipal systems past their treatment plant’s rated capacity, which means the slower a utility is to find these sources, the longer it’s absorbing unnecessary treatment costs and overflow risk in the meantime. That’s the real cost of a multi-year assessment timeline: it isn’t just the labor hours, it’s every storm that passes while the problem stays undiagnosed.
Project at a Glance
- System Size: ~70 miles of collection system
- Duration: June – September 2025 (4 months)
- Deployment: 423 radar-based level sensors installed across the system
- Major Rain Events Captured: July 15, July 31, August 14, September 7
- Data Tools: Hydrographs + high-resolution weather integration, interactive GIS dashboard, Manhole Virtual Models (MVMs)
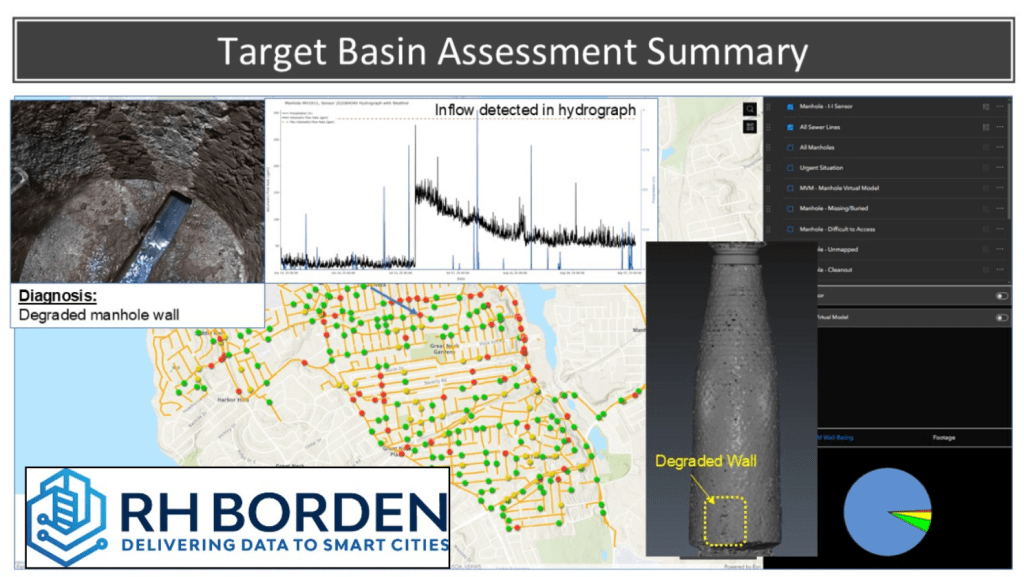
During four major storm events, BASINiQ captured real-time data that revealed patterns in the water flow at each manhole:
- Inflow: Abrupt spikes in hydrographs indicated stormwater entering through open risers, manhole defects, and surface-level connections.
- Infiltration: Slow, lingering flow increases confirmed groundwater intrusion through degraded joints, cracks, and root intrusions.
- Blockages: Erratic disruptions highlighted locations with partial obstructions or debris.
By September 2025, BASINiQ had identified 74 specific locations of I&I based on the BASINiQ flow calculations. Each location was documented with flow data, GIS mapping, and digital imagery, enabling targeted remediation actions such as fixing cleanout caps, inspecting and repairing pipes, rehabbing manholes, and repairing defects.
Results and Benefits
- Speed: Majority of I&I sources located in 4 months, compared to 5–10 years with traditional methods.
- Cost Efficiency: Assessment completed at less than half the cost of traditional approaches.
- Accuracy: Instead of general problem areas, the study produced specific, verifiable repair targets.
- Decision Support: The GIS dashboard and digital twins provide an ongoing resource for monitoring, prioritization, and validation of rehabilitation effectiveness.
The BASINiQ methodology combined three key elements:
- Sensor-Dense Monitoring: 423 radar-based sensors deployed every 300-800 feet using BASINiQ algorithms to calculate flow in each manhole.
- Manhole Virtual Models (MVMs): High-resolution 3D scans and 360° imagery created digital twins of manholes, identifying structural defects and inflow pathways not visible during conventional inspections.
- Weather-Integrated Flow Analysis: Hydrographs were correlated with localized rainfall data to distinguish inflow from infiltration, blockages, and normal flow variation.
What This Means for Other Utilities
Great Neck’s system isn’t unusual. Aging clay and concrete collection pipe, decades-old manholes, and a mix of legal and illegal stormwater connections describe a huge share of municipal wastewater systems across North America. What made the difference here wasn’t the presence of I&I, nearly every older system has some, it was the speed and specificity of finding it. A utility manager reading this case study should take away three things: first, sensor density matters more than sensor count alone, placing 423 sensors every 300 to 800 feet is what allowed BASINiQ to isolate individual manholes rather than general zones. Second, correlating flow data against actual rainfall timing is what separates inflow from infiltration with confidence, rather than lumping both into one vague number. Third, a documented, GIS-mapped result set is what turns a study into an actual repair plan, instead of a report that sits on a shelf.
How This Data Keeps Working After the Study Ends
One detail worth highlighting: the GIS dashboard and Manhole Virtual Models built during this project didn’t expire when the four-month study wrapped up. Great Neck now has a living digital record of its collection system, one that can be used to prioritize future rehabilitation budgets, validate whether repairs actually reduced flow, and give engineers a starting point for the next capital improvement plan instead of starting from zero. That’s a meaningful difference from traditional inspection methods, which typically produce a static report rather than a reusable asset.
Ready to Find Your System’s I&I Sources Faster?
Great Neck’s results show what’s possible when a utility replaces years of manual guesswork with a few months of precise, data-backed detection. If your system is losing budget to unexplained wet-weather flow, the same BASINiQ methodology used here can help pinpoint exactly where it’s happening, and give your team a documented plan for fixing it.
Contact RH Borden to schedule a call and discuss your I&I challenges, or explore BASINiQ’s I&I location services to see how this approach could work for your system.

Frequently Asked Questions
How does BASINiQ find I&I faster than traditional inspection methods?
By combining hundreds of radar-based sensors with weather-correlated flow data, BASINiQ can isolate specific manholes in real time during actual storm events, rather than relying on crews to manually inspect miles of pipe one segment at a time.
Can this level of sensor density work for smaller collection systems?
Yes. Sensor spacing and total count scale to the size of the system being studied. What matters is density relative to system size, not a fixed sensor count.
What happens after I&I sources are identified?
Each documented location comes with flow data, GIS mapping, and imagery, giving utilities a prioritized, verifiable repair list rather than a general problem area to investigate further.
Is this approach specific to Great Neck, or can other municipalities use it?
The methodology is designed to apply nationwide. Great Neck’s results reflect what’s possible for any collection system dealing with aging infrastructure and unclear I&I sources.