

Key Takeaways
|
Smart sewer monitoring combines acoustic assessments, 3D manhole scanning, and GIS dashboards to locate defects and I&I sources before they cause overflows or budget overruns.
Smart sewer network monitoring replaces guesswork with measurable, mapped data on a collection system’s true condition. Instead of reacting to a backup after it happens, utilities use acoustic assessments, high density scanning, and centralized dashboards to see where a pipe or manhole is degrading before it fails.
The EPA’s Smart Sewers program documents real cases of this shift paying off. South Bend, Indiana installed smart sensors across its collection system and has since saved about $1.5 million a year in operating costs while avoiding an estimated $500 million in capital improvements.
The takeaway: if your maintenance plan still runs on fixed replacement cycles instead of condition data, you are likely spending on assets that do not need it, while missing the ones that do.
Every collection system manager eventually hits the same wall. Budgets are finite, the inventory keeps aging, and a five year inspection rotation can no longer keep pace with the answers a utility needs.
Smart sewer network monitoring is the response. It combines acoustic technology, digital twin modeling, high-density sensor networks, and dashboard reporting so an engineering team can see the condition of thousands of assets at once, ranked by severity.
RH Borden’s approach is built around combining acoustic assessments with high density 3D manhole scanning, then feeding both into a single GIS dashboard so nothing gets buried in a spreadsheet no one opens again.
This article covers what smart sewer monitoring involves, the technologies behind it, and what a data-driven maintenance program looks like in practice.
What Counts as “Smart” Sewer Monitoring
Moving Past the Annual Walkthrough
For decades, sewer condition assessment meant a crew cleaning the system and writing down what they saw. It worked, but it was slow and hard to scale across thousands of structures.
Smart monitoring replaces that walkthrough with repeatable, measurable data. A crack documented today can be measured again in two years using the same reference points, tracking degradation instead of comparing inspectors’ notes.
The Role of Acoustic Assessment
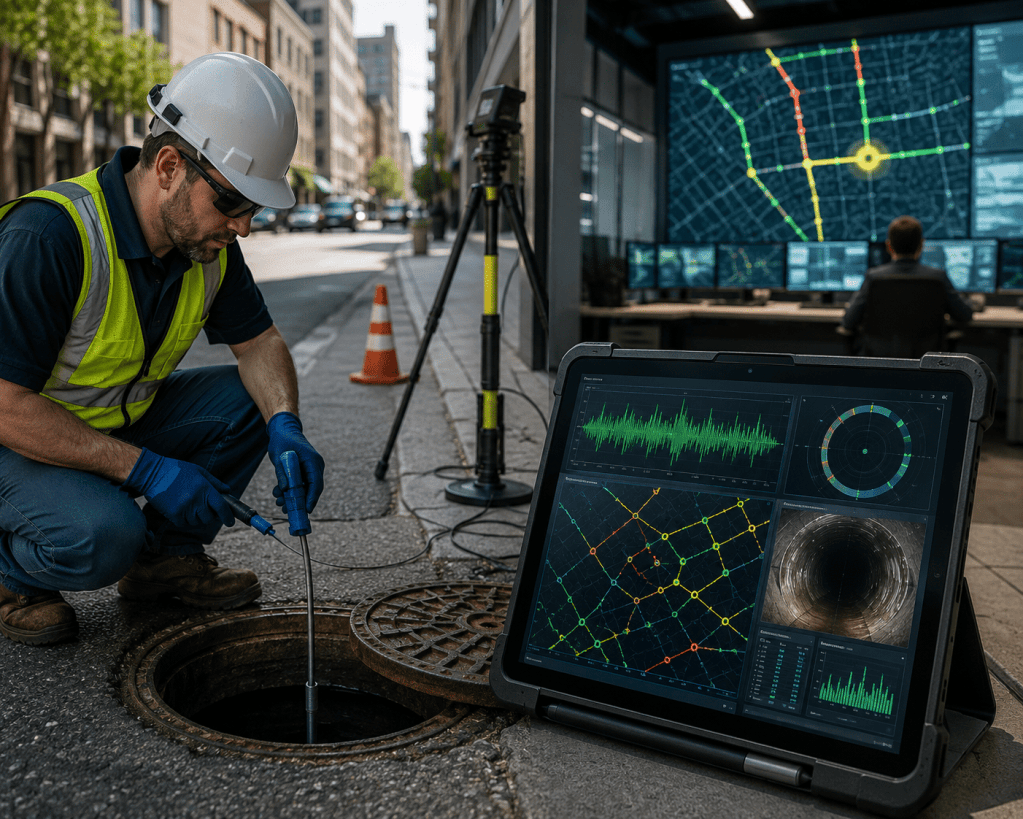
In Acoustic Assessment, the Sewer Line – Rapid Assessment tool (SL-RAT) sends a sound signal through a pipe segment and measure how it changes on the other end. A clear signal means an open pipe. A degraded signal identifies an obstructed flow worth a closer look.
This lets a utility screen miles of pipe in a single day without sending a crew into a confined space for each segment. It is a triage tool that tells you where to spend the detailed inspection budget.
The Digital Twin Advantage
Why Manholes Deserve Their Own Model
Manholes are one of the most overlooked entry points for I&I, yet they rarely get the inspection rigor pipe segments do. A cracked bench or corroded frame can let in I&I just like a defect in a pipe.
A high definition 3D scan turns each manhole into a Manhole Virtual Model, a digital twin an engineer can rotate and measure without a return visit. Depth, diameter, and offset can all be pulled directly from the model.
Reading Condition at a Glance
Once scanned, a manhole gets tagged red for active failure, yellow for early degradation, or green for structurally sound. This turns technical detail into something a council member reviewing a budget can understand in seconds.
Turning Data Into a Defensible Repair Plan
The Dashboard Is the Product
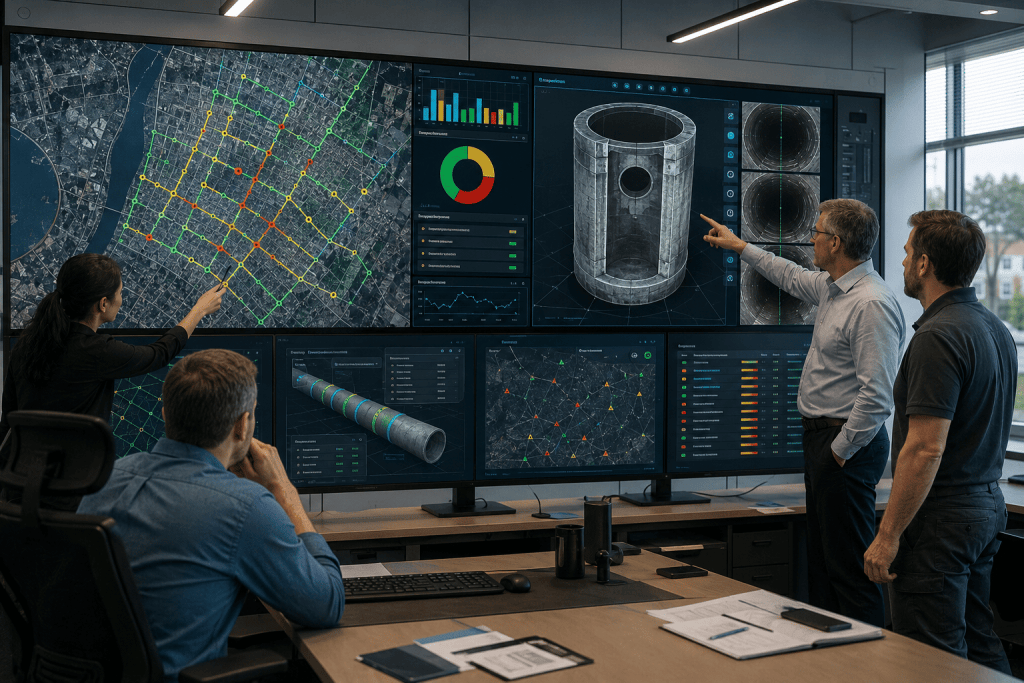
Collecting data is only half the job. The real value shows up when acoustic results, manhole scans, and GIS location data live in one dashboard, sortable by severity and other characteristics.
RH Borden’s GIS dashboard ties every acoustic result, I&I signal, and manhole scan back to its exact location on the map, giving engineers one ranked list instead of three disconnected reports to reconcile by hand.
Making the Case to Budget Reviewers
Capital committees do not fund vague requests. A ranked, color-coded repair list gives a utility something concrete: not “this area needs work,” but “these fourteen manholes are flagged red, here is what each costs in excess treatment volume.”
A Real-World Example
South Bend’s program also eliminated dry weather overflows and cut combined sewer overflow volume by more than 70 percent, roughly a billion gallons a year. That kind of documented result is what turns a repair list into an approved budget line.
Traditional Inspection vs. Smart Monitoring
| Factor | Traditional Approach | Smart Monitoring |
| Data format | Handwritten notes, photos | Measurable 3D models, GIS-tagged results |
| Repeatability | Varies by inspector | Consistent, comparable over time |
| Crew exposure | Often requires manhole entry or flow contact | Largely zero-entry, surface-based |
| Prioritization | Manual, subjective | Color-coded, severity-ranked |
| Budget defense | Anecdotal | Documented, asset-specific |
DIY Monitoring vs. Bringing in a Specialist
Some utilities build scanning capability in-house, but labor shortages, budgetary restrictions, and rapidly-changing technology usually makes it more attractive to bring in outside expertise and manpower.
Running acoustic assessment and 3D scanning internally means more than buying a piece of equipment. It means training staff to operate and calibrate the hardware, building the software workflow to turn raw scans into usable condition data, and keeping that expertise on staff even as turnover happens.
The greatest challenge to systems wanting to move to a smart sewer is that this shift is fundamentally a move to preventative, proactive maintenance. Everyone wants to be proactive, but the urgent problems of the day so often crowd out the preventative work that needs to happen. We hear all the time, “We want the guys to go out and get the SL-RAT footage, but we keep having emergencies.
Questions to Ask Before Choosing a Monitoring Partner
Ask any provider how data is delivered, whether scans produce a true digital twin, how repairs get prioritized, and whether crews can work zero-entry. A vague answer usually means a service, not a system.
How Is the Data Delivered?
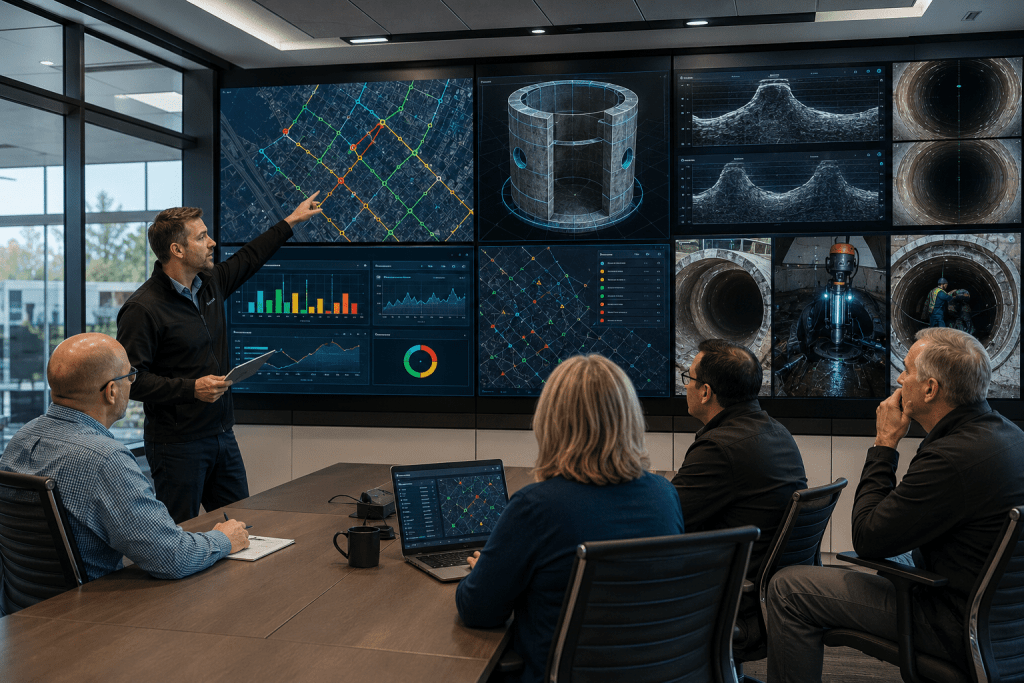
A provider who hands over a static PDF report is offering a snapshot, not a system. Ask whether the deliverable is an interactive, GIS-tagged dashboard you can filter by severity, neighborhood, or pipe material, and whether that dashboard stays accessible after the initial assessment or disappears once the invoice is paid.
Is It a True Digital Twin or Just Photos?
Photos and video document a defect. A true digital twin, like a Manhole Virtual Model, lets an engineer measure depth, diameter, and offset directly from the model, months or years later, without a return site visit. Ask for a sample model before signing anything, and try measuring something in it yourself.
How Are Repairs Actually Prioritized?
A useful partner does not just hand back raw findings. They apply a consistent, color-coded severity scale, red, yellow, green, or something comparable, so a non-engineer reviewing the results can tell at a glance which assets need attention first. Ask to see how that scale is defined and whether it holds up across different pipe materials and manhole types.
Can Crews Work Zero-Entry?
Confined space entry adds cost, time, and risk to every inspection. Ask whether the provider’s standard workflow scans from the surface, and how often, if ever, a crew still needs to physically enter a manhole to complete an assessment. Fewer entries generally means faster turnaround and a safer program for everyone involved.
What Happens After the Assessment?
A one-time report is only useful for one budget cycle. Ask whether the provider supports rescanning on a schedule, how pricing changes for repeat assessments, and whether prior scans stay archived and comparable, so degradation can actually be tracked over time rather than re-measured from zero every time.
Smart Monitoring Is the New Baseline
Sewer systems are not getting any younger, and calendar-based maintenance is running out of runway. Smart sewer network monitoring, built on acoustic screening, 3D manhole modeling, and a centralized GIS dashboard, gives collection system managers a current, defensible picture of exactly where the risk sits today.
Ready to see where your system’s biggest risks are actually hiding? Learn how RH Borden’s condition-based maintenance program can turn your next inspection cycle into a ranked, fundable repair plan. Contact us now!

Frequently Asked Questions
What is smart sewer network monitoring?
Using acoustic assessment, 3D scanning, sensor networks, and GIS dashboards to track a sewer system’s actual condition over time.
How is this different from a standard sewer inspection?
Standard inspections rely on handwritten notes and visual judgment. Smart monitoring produces measurable, repeatable data tied to a location.
Does it require crews to enter every manhole?
No. Acoustic screening and surface scanning are largely zero-entry, reducing confined space exposure.
Can this data help secure funding for repairs?
Yes. A documented list of defects is far easier to defend than a general age-based request.
How often should a system be rescanned?
It depends on age and prior findings, though red-flagged assets are often revisited sooner than sound, green ones.
